Match reportIce Hockey
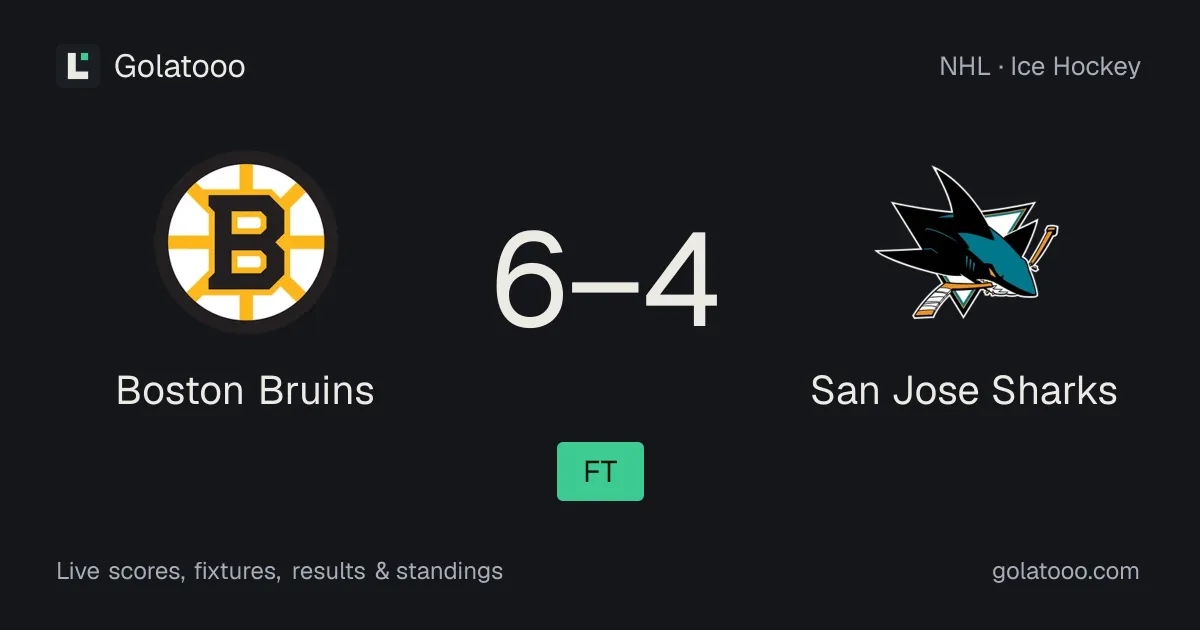
Boston Bruins 6-4 San Jose Sharks: match report and statistics
Boston Bruins 6-4 San Jose Sharks in NHL on Saturday, 24 October 2026. Key moments, statistics and the impact on the standings.
Automated analysis by Golatooo
Key facts
- Final score
- Boston Bruins 6-4 San Jose Sharks
- Competition
- NHL
- Date
- Saturday, 24 October 2026
- Venue
- TD Garden, Boston
- Attendance
- 17850
Match summary
NHL, Saturday, 24 October 2026: Boston Bruins came out on top against San Jose Sharks, winning 6-4. The margin of victory was 2 goals.
The game was played at TD Garden, Boston. The recorded attendance was 17,850.
Before the start
Over their last 5 games Boston Bruins have 4 wins and 1 defeat. They scored 22 goals and let in 9 goals (W-W-W-L-W).
Over their last 5 games San Jose Sharks have 3 wins and 2 defeats. They scored 17 goals and let in 14 goals (W-L-L-W-W).
The previous meeting between the sides before this game was San Jose Sharks 3-6 Boston Bruins on Wednesday, 14 October 2026.
| Team | Date | Opponent | H/A | Score | Result |
|---|---|---|---|---|---|
| Boston Bruins | 22 Oct | Nashville Predators | H | 6-0 | W |
| Boston Bruins | 21 Oct | Dallas Stars | A | 2-3 | L |
| Boston Bruins | 18 Oct | Los Angeles Kings | A | 4-1 | W |
| Boston Bruins | 17 Oct | Anaheim Ducks | A | 4-2 | W |
| Boston Bruins | 14 Oct | San Jose Sharks | A | 6-3 | W |
| San Jose Sharks | 22 Oct | Ottawa Senators | A | 6-2 | W |
| San Jose Sharks | 20 Oct | Montreal Canadiens | A | 4-3 | W |
| San Jose Sharks | 19 Oct | Toronto Maple Leafs | A | 1-3 | L |
| San Jose Sharks | 17 Oct | Detroit Red Wings | A | 3-4 | L |
| San Jose Sharks | 16 Oct | Nashville Predators | A | 3-2 | W |
Scoring and key moments
The match produced 10 goals.
Impact on the table
In the latest standings San Jose Sharks are 8th with 13 points from 12 matches.
| # | Team | P | W | L | GF | GA | GD | Pts |
|---|---|---|---|---|---|---|---|---|
| 1 | Minnesota Wild | 13 | 8 | 3 | 41 | 30 | +11 | 18 |
| 2 | Edmonton Oilers | 11 | 8 | 2 | 49 | 39 | +10 | 17 |
| 3 | Vegas Golden Knights | 13 | 8 | 4 | 47 | 38 | +9 | 17 |
| 4 | Utah Mammoth | 12 | 8 | 4 | 46 | 40 | +6 | 16 |
| 5 | Dallas Stars | 11 | 7 | 3 | 32 | 20 | +12 | 15 |
| 8 | San Jose Sharks | 12 | 6 | 5 | 37 | 43 | -6 | 13 |
The full timeline, line-ups and statistics for Boston Bruins vs San Jose Sharks stay available on the match page.
This article is generated automatically from live match, standings and form data. Figures can change as data is updated.
Related pages
More analysis
- Match previewIce Hockey
Philadelphia Flyers vs Columbus Blue Jackets: preview, form, head-to-head and how to watch
NHL, Tuesday, 27 October 2026: Philadelphia Flyers vs Columbus Blue Jackets. Standings, recent form, head-to-head record and TV listings.
Read article - Match reportIce Hockey
Vancouver Canucks 2-4 Minnesota Wild: match report and statistics
Vancouver Canucks 2-4 Minnesota Wild in NHL on Monday, 26 October 2026. Key moments, statistics and the impact on the standings.
Read article - Match reportIce Hockey
Nashville Predators 6-2 Colorado Avalanche: match report and statistics
Nashville Predators 6-2 Colorado Avalanche in NHL on Monday, 26 October 2026. Key moments, statistics and the impact on the standings.
Read article