Match reportFootball
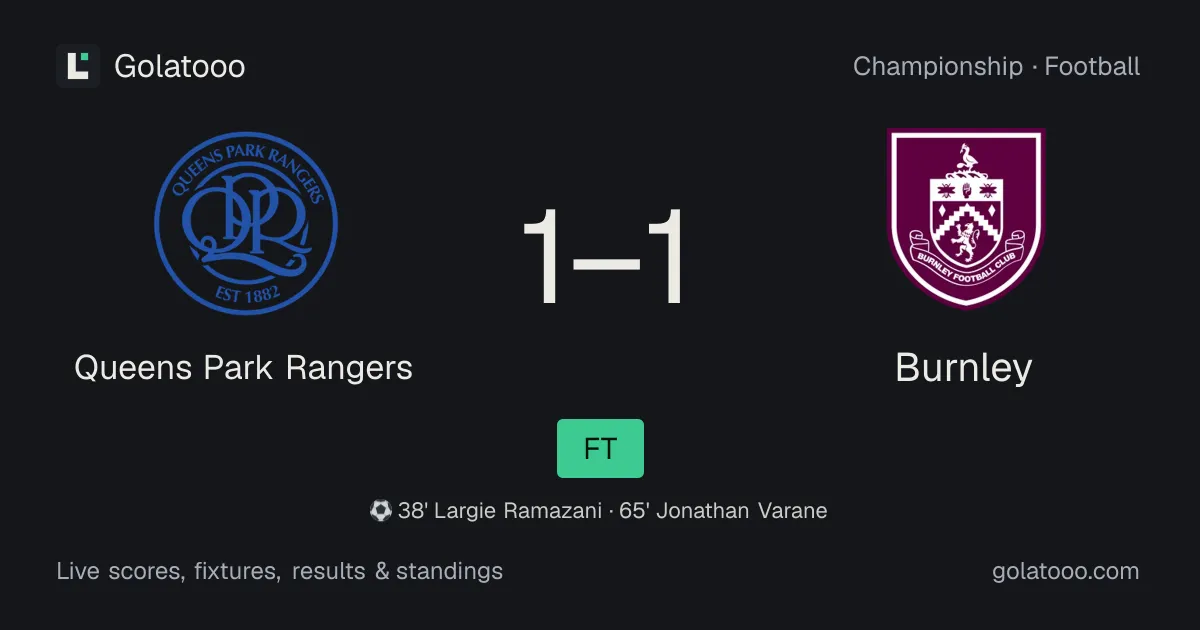
Queens Park Rangers 1-1 Burnley: match report, goals and statistics
Queens Park Rangers 1-1 Burnley in Championship on Tuesday, 3 November 2026. Goals, cards, statistics and the impact on the table.
Automated analysis by Golatooo
Key facts
- Final score
- Queens Park Rangers 1-1 Burnley
- Competition
- Championship
- Date
- Tuesday, 3 November 2026
- Venue
- MATRADE Loftus Road, London
Match summary
Queens Park Rangers and Burnley drew 1-1 in Championship on Tuesday, 3 November 2026.
Burnley led 1-0 at half-time. The game was played at MATRADE Loftus Road, London.
Before kick-off
Queens Park Rangers: 2 wins, 1 draw and 2 defeats in their last 5 matches (D-W-L-W-L), scoring 11 goals and conceding 9 goals.
Burnley: 1 win, 2 draws and 2 defeats in their last 5 matches (W-D-L-L-D), scoring 8 goals and conceding 8 goals.
Queens Park Rangers arrive in better form, taking 7 of a possible 15 points from their recent matches, compared with 5 for Burnley.
| Team | Date | Opponent | H/A | Score | Result |
|---|---|---|---|---|---|
| Queens Park Rangers | 31 Oct | Southampton | A | 1-4 | L |
| Queens Park Rangers | 24 Oct | Swansea City | H | 5-0 | W |
| Queens Park Rangers | 17 Oct | Birmingham City | A | 0-3 | L |
| Queens Park Rangers | 14 Oct | Derby County | H | 4-1 | W |
| Queens Park Rangers | 9 Oct | West Ham United | A | 1-1 | D |
| Burnley | 31 Oct | Portsmouth | H | 0-0 | D |
| Burnley | 24 Oct | Lincoln City | A | 1-4 | L |
| Burnley | 16 Oct | Wolverhampton Wanderers | H | 1-2 | L |
| Burnley | 13 Oct | Charlton Athletic | H | 2-2 | D |
| Burnley | 10 Oct | Watford | A | 4-0 | W |
Goals and key moments
The match produced 2 goals.
Largie Ramazani found the net for Burnley in minute 38, making it 0-1. Jonathan Varane found the net for Queens Park Rangers in minute 65, making it 1-1.
| Minute | Team | Player | Type | Score |
|---|---|---|---|---|
| 38' | Burnley | Largie Ramazani | Goal | 0-1 |
| 65' | Queens Park Rangers | Jonathan Varane | Goal | 1-1 |
Discipline and substitutions
The match saw 3 yellow cards: 1 for Queens Park Rangers and 2 for Burnley.
Substitutions recorded: 5 substitutions for Queens Park Rangers and 4 substitutions for Burnley.
Match statistics
Queens Park Rangers had 57.8% of possession, against 42.2% for Burnley.
Queens Park Rangers had 20 shots, 5 on target, while Burnley had 4 shots, 1 on target. Queens Park Rangers won 8 corners and Burnley won 1 corner. Queens Park Rangers committed 5 fouls and Burnley committed 7 fouls.
Queens Park Rangers had the most shots on target (5).
| Statistic | Queens Park Rangers | Burnley |
|---|---|---|
| Possession | 57.8% | 42.2% |
| Shots | 20 | 4 |
| Shots on target | 5 | 1 |
| Corners | 8 | 1 |
| Fouls | 5 | 7 |
| Saves | 0 | 4 |
| Offsides | 3 | 4 |
| Yellow cards | 1 | 2 |
| Red cards | 0 | 0 |
Impact on the table
The table shows Queens Park Rangers in 11th place (21 points from 14 matches) and Burnley in 22nd place (10 points from 14 matches). Queens Park Rangers hold a 11 points advantage over Burnley in the standings.
Burnley are currently in the relegation places.
| # | Team | P | W | D | L | GF | GA | GD | Pts |
|---|---|---|---|---|---|---|---|---|---|
| 1 | Middlesbrough | 13 | 8 | 4 | 1 | 30 | 17 | +13 | 28 |
| 2 | Birmingham City | 14 | 7 | 5 | 2 | 26 | 13 | +13 | 26 |
| 3 | Stoke City | 14 | 8 | 2 | 4 | 22 | 17 | +5 | 26 |
| 4 | Swansea City | 14 | 8 | 2 | 4 | 21 | 16 | +5 | 26 |
| 5 | West Bromwich Albion | 14 | 7 | 4 | 3 | 20 | 15 | +5 | 25 |
| 11 | Queens Park Rangers | 14 | 5 | 6 | 3 | 22 | 17 | +5 | 21 |
| 22 | Burnley | 14 | 1 | 7 | 6 | 18 | 26 | -8 | 10 |
The full timeline, line-ups and statistics for Queens Park Rangers vs Burnley stay available on the match page.
This article is generated automatically from live match, standings and form data. Figures can change as data is updated.
Related pages
More analysis
- Match reportFootball
FC Seoul 3-0 The Cong-Viettel FC: match report, goals and statistics
FC Seoul 3-0 The Cong-Viettel FC in AFC Champions League Two on Wednesday, 4 November 2026. Goals, cards, statistics and the impact on the table.
Read article - Match reportFootball
Pohang Steelers 3-3 Gamba Osaka: match report, goals and statistics
Pohang Steelers 3-3 Gamba Osaka in AFC Champions League Elite on Wednesday, 4 November 2026. Goals, cards, statistics and the impact on the table.
Read article - Match previewFootball
Botafogo-SP vs Londrina: preview, form, head-to-head and how to watch
Brasileirao Serie B, Thursday, 5 November 2026: Botafogo-SP vs Londrina. Standings, recent form, head-to-head record and TV listings.
Read article